Comprehensive Analysis of Vehicle Emissions and Electric Vehicle AdoptionThis document provides a thorough comparison of tailpipe emissions across various vehicle types, evaluates energy efficiency metrics, tracks the growth of charging infrastructure, highlights advancements in battery technology, examines government incentives for electric vehicle (EV) adoption, analyzes the total cost of ownership for EVs versus gasoline-powered cars, and reviews environmental impact assessments related to the entire lifecycle of EVs.
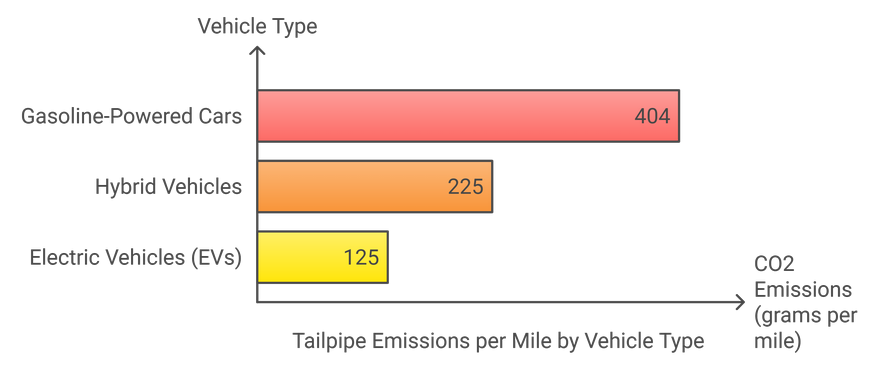
Tailpipe Emissions
Grams of CO2 Emitted per Mile
Gasoline-Powered Cars On average, gasoline-powered vehicles emit approximately 404 grams of CO2 per mile.
Hybrid Vehicles Hybrids typically emit around 200-250 grams of CO2 per mile, depending on their design and efficiency.
Electric Vehicles (EVs) While EVs have no tailpipe emissions, the indirect emissions depend on the energy source used for electricity generation. On average, EVs can be estimated to emit around 100-150 grams of CO2 per mile when considering the electricity generation mix.
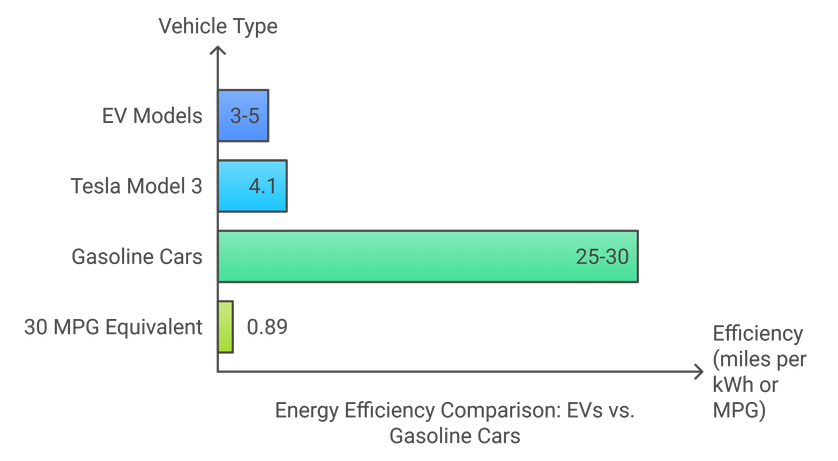
Energy Efficiency
Miles per Kilowatt-Hour (kWh) for EVs vs. Miles per Gallon (MPG) for Gasoline Cars
Electric Vehicles The efficiency of various EV models can range from 3 to 5 miles per kWh. For example, the Tesla Model 3 averages about 4.1 miles per kWh.
Gasoline-Powered Cars The average MPG for gasoline cars is around 25-30 MPG. To compare, 1 gallon of gasoline is approximately equivalent to 33.7 kWh of energy. Therefore, a car that achieves 30 MPG would be equivalent to about 0.89 miles per kWh.
Charging Infrastructure
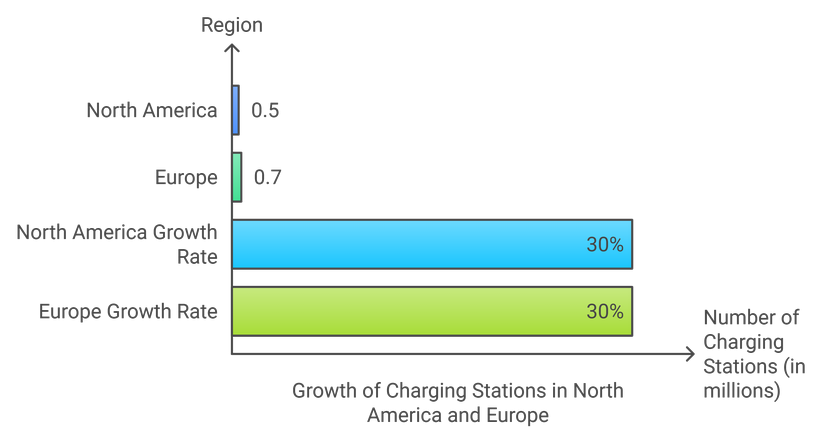
Growth of Charging Stations Worldwide
The number of charging stations has been rapidly increasing, with over 1.5 million public charging points globally as of 2023. In regions such as North America and Europe, the growth rate has been approximately 30% annually, driven by government initiatives and increasing EV adoption.
Battery Technology Advancements
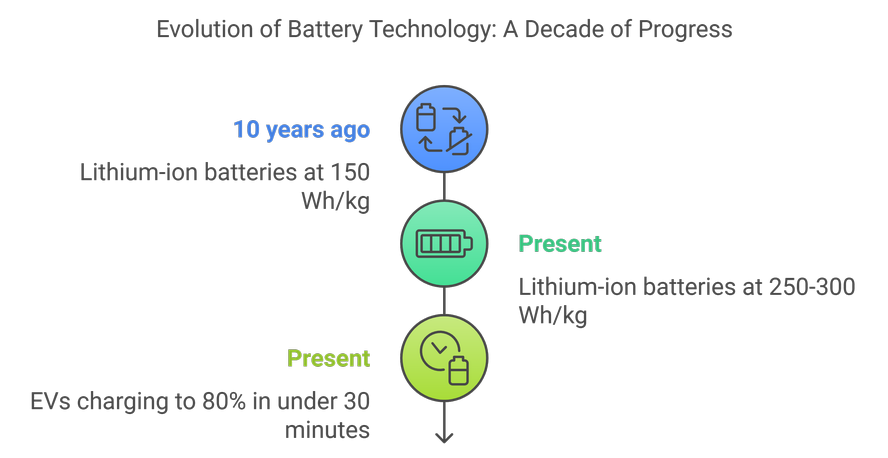
Improvements in Battery Energy Density and Charging Times
Over the past decade, battery energy density has improved significantly, with lithium-ion batteries now reaching around 250-300 Wh/kg, compared to 150 Wh/kg a decade ago. Charging times have also decreased, with many modern EVs capable of charging to 80% in under 30 minutes using fast chargers.
Government Incentives
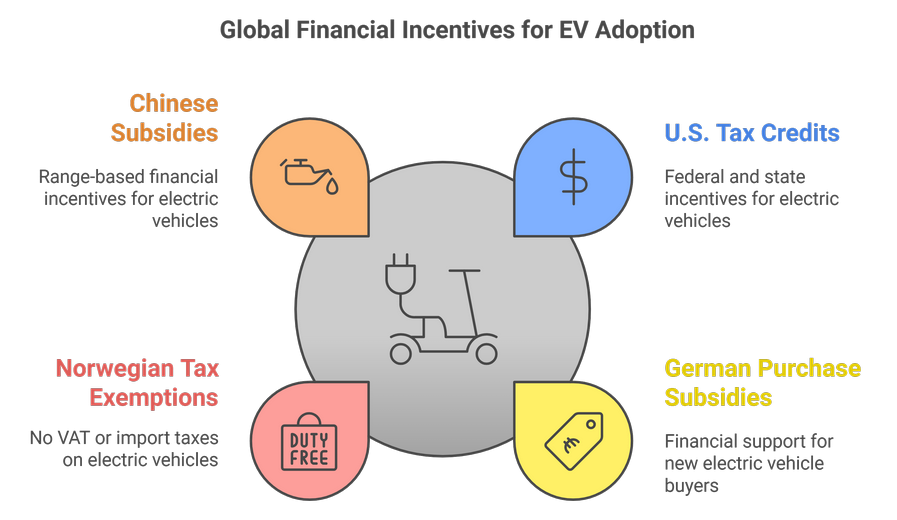
Financial Incentives for EV Adoption
Different countries offer various incentives to encourage EV adoption
United States Federal tax credits up to $7,500, plus state incentives.
Germany Up to €9,000 for new EV purchases.
Norway No VAT or import taxes on EVs, along with free tolls and parking.
China Subsidies that can reach up to $4,500 depending on the vehicle’s range.
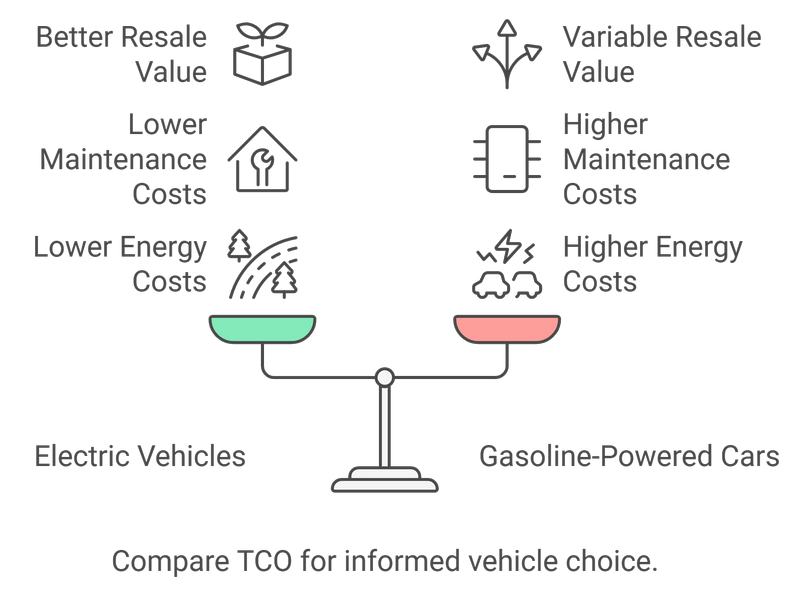
Total Cost of Ownership
Overall Cost Comparison
When calculating the total cost of ownership (TCO) for EVs versus gasoline-powered cars, consider
Purchase Price EVs typically have a higher upfront cost.
Energy Costs EVs generally have lower energy costs per mile.
Maintenance EVs have fewer moving parts, leading to lower maintenance costs.
Resale Value EVs are gaining value retention, but this varies by model.
A typical TCO analysis shows that over a 5-year period, EVs can be more economical than gasoline cars, especially when factoring in incentives and lower operating costs.
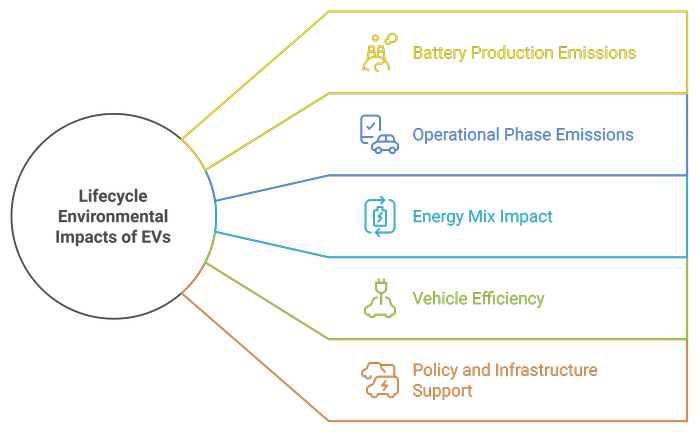
Environmental Impact Assessments
Lifecycle Environmental Impacts
Studies have shown that while EVs have higher emissions during battery production, they significantly reduce overall emissions during their operational phase. Research indicates that the lifecycle emissions of EVs can be 30-50% lower than those of gasoline vehicles, depending on the energy mix used for electricity generation and the efficiency of the vehicle.
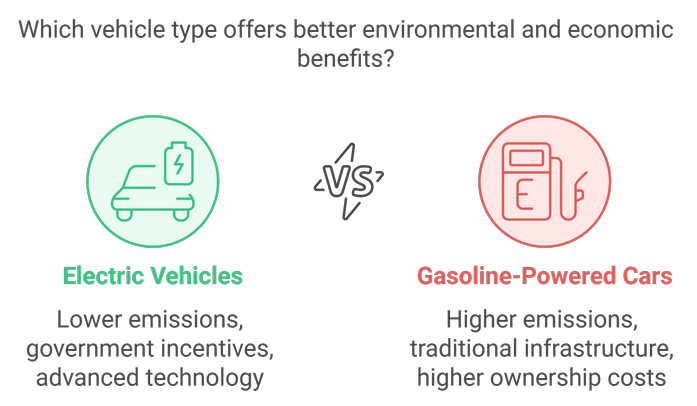
In conclusion, the transition to electric vehicles presents a promising opportunity to reduce emissions and promote sustainability, supported by advancements in technology, infrastructure, and government policies.